Trading Systems That Work
Designed, Modified and Tested by Traders Around the World
Get All Systems Now!Files Will be emailed

Shay Campbell,
Creator of TimingCharts.com
"3 years ago I brought together 200 traders from around the world to design commercial grade systems.. Now I’m sharing the best of those systems with Timing Charts users!"
Top 3 Trading Systems
No matter how many systems we tested, three of them kept
floating to the top of the list. They produced the most profits, worked consistently across diverse
markets and showed the best risk/reward metrics.
And the only thing they have in common is
the intent to catch trends as they begin. Other than that, the approach of each is considerably
different.
Out of all the systems designed and tested by over 200 traders, the most
profitable method was trend trading. The fact that the top 3 systems were designed to catch the big
trends should not be taken lightly. In the highly competitive world of trading, every edge, no
matter how slight, should be capitalized.
The details of each of these systems are being
offered to you now. All rules are openly shared so you know exactly how and why they work. And more
importantly, so you can trade them for yourself!
Trend Weaver
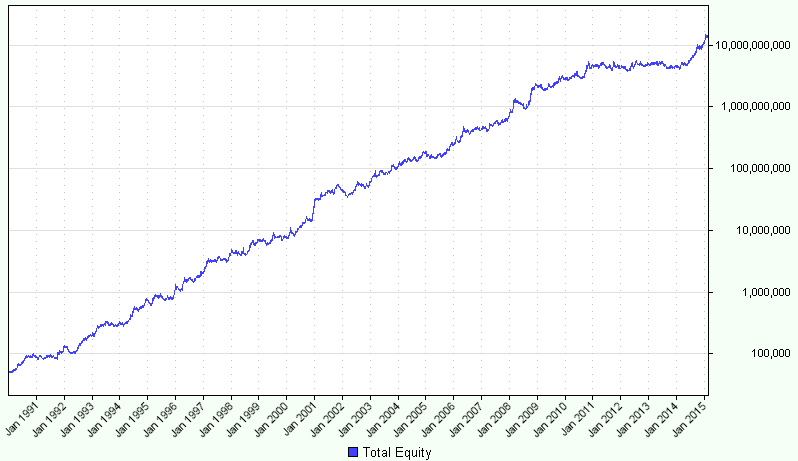
Average Return: 64.41%
Max Drawdown: 37.8%
Profit
Factor: 1.42
Futures Truth Top 10 Most Consistent System
Trend Weaver uses a unique trend filter to determine the direction of the next trade. Trades are only allowed in the direction of the trend.
Once in a position, an exit order trails the position based on the momentum and range of the market.
This gives the trade a reasonable chance to accumulate profits without risking an excessive amount per trade.
The system works on individual markets with varying parameter sets or on a portfolio with shared parameter sets.
Diversified Portfolio Used in Backtest
AUD/USD, Corn, Crude Oil, Cotton, Euro Bond, UD Dollar Index, EUR/USD, Eurodollar, Feeder Cattle, Gold, Copper, USD/JPY, Lumber, Lean Hogs, Natural Gas, Orange Juice, Palladium, Soybeans, Sugar.
A deduction of $40 per contract traded was used to simulate slippage and commission for each transaction. The same exact rules and parameter sets were applied to each market and throughout the test. This system could certainly be applied to one market at a time with varying parameter sets. Doing so would result in far better results than even shown here.
Get all systems on this page
- System Code - TradeStation - Multicharts - Trading Blox - Ninja Trader
- Back-Adjusted Data files - One-time download
Hi-Lo Trend
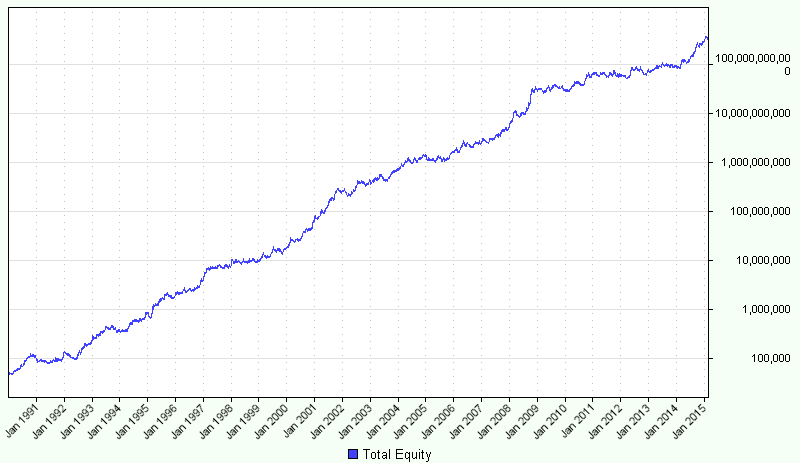
Average Return: 87.2%
Max Drawdown: 37.3%
Profit
Factor: 1.44
This is a unique system because it takes into account range cycles. Most trending systems are only concerned with the position of price in relation to the recent past.
Hi-Lo Trend only enters new positions when the range cycles indicate the market is ready to go.
Based on the huge edge this system enjoys it’s unlikely too many are using a similar
strategy. Particularly interesting are the portfolio results which have produced steady
profits for more than 20 years.
Diversified Portfolio Used in Backtest
AUD/USD, Corn, Crude Oil, Cotton, Euro Bond, UD Dollar Index, EUR/USD, Eurodollar, Feeder Cattle, Gold, Copper, USD/JPY, Lumber, Lean Hogs, Natural Gas, Orange Juice, Palladium, Soybeans, Sugar.
A deduction of $40 per contract traded was used to simulate slippage and commission for each transaction. The same exact rules and parameter sets were applied to each market and throughout the test. This system could certainly be applied to one market at a time with varying parameter sets. Doing so would result in far better results than even shown here.
Get all systems on this page
- System Code - TradeStation - Multicharts - Trading Blox - Ninja Trader
- Back-Adjusted Data files - One-time download
Swing Machine
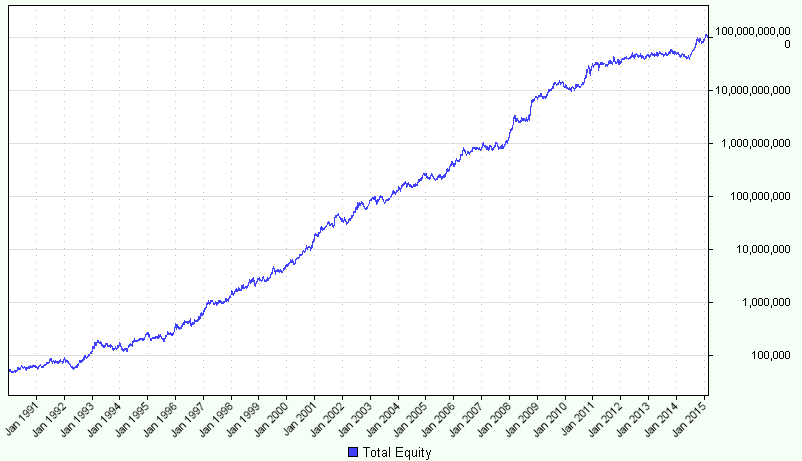
Average Return: 77.8%
Max Drawdown: 39.1%
Profit
Factor: 1.27
In response to sluggish trend following systems, Swing Machine responds with smart entries and quick exits when the market goes against the trade.
The Swing Machine measures the recent range of the market and enters trades when the
range begins to expand.
This approach attempts to keep the system flat during choppy non-directional periods and only enters a new position when the market is on the move.
As you can see from the equity graph, it does a good job of capturing gains while avoiding large losses.
Diversified Portfolio Used in Backtest
AUD/USD, Corn, Crude Oil, Cotton, Euro Bond, UD Dollar Index, EUR/USD, Eurodollar, Feeder Cattle, Gold, Copper, USD/JPY, Lumber, Lean Hogs, Natural Gas, Orange Juice, Palladium, Soybeans, Sugar.
A deduction of $40 per contract traded was used to simulate slippage and commission for each transaction. The same exact rules and parameter sets were applied to each market and throughout the test. This system could certainly be applied to one market at a time with varying parameter sets. Doing so would result in far better results than even shown here.
Get all systems on this page
- System Code - TradeStation - Multicharts - Trading Blox - Ninja Trader
- Back-Adjusted Data files - One-time download
Want all Top 3 Systems?
Get Bonus E-Mini S&P 500 System included
Mini-Mean
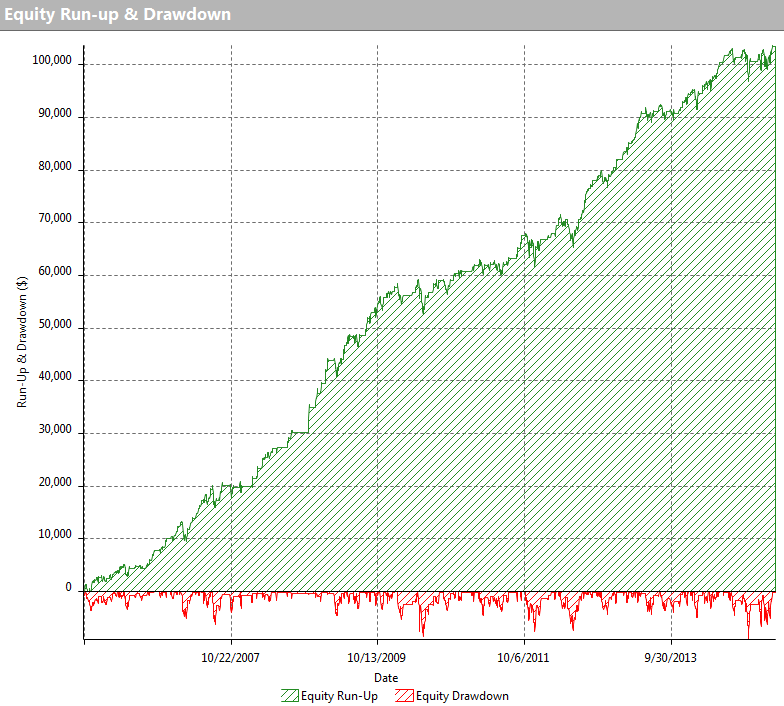
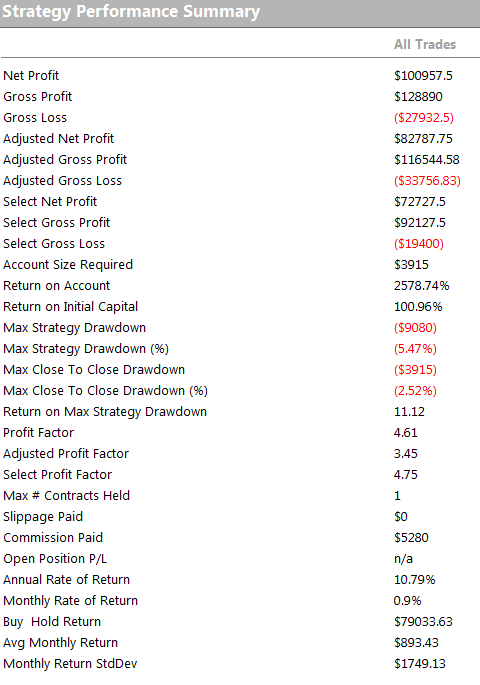
Mini-Mean only trades the E-Mini S&P 500 contract. Many of the
members in the Trading Systems Network wanted to trade index futures (trend following systems do not
work on indexes) so Mini-Mean was created. It's a Mean Reversion or Swing Trading system
which is different than the Trend Following approach used by the Top 3 Systems.
The results above
were created with just 1 contract traded per signal. $20 per trade deducted to represent slippage and
commission. This system was created 3 years ago and the results are still as strong today as they
were then.
Top 3 Plus Mini-Mean
One Time Payment
- Files will be emailed for:
- TradeStation - Multicharts - Trading Blox - Ninja Trader
No Mini-Mean files for Ninja Trader - One time download of Back Adjusted Futures Contracts

HYPOTHETICAL PERFORMANCE RESULTS HAVE MANY INHERENT LIMITATIONS,
SOME OF WHICH ARE DESCRIBED BELOW. NO REPRESENTATION IS BEING MADE THAT ANY ACCOUNT WILL OR IS LIKELY TO
ACHIEVE PROFITS OR LOSSES SIMILAR TO THOSE SHOWN. IN FACT, THERE ARE FREQUENTLY SHARP DIFFERENCES
BETWEEN HYPOTHETICAL PERFORMANCE RESULTS AND THE ACTUAL RESULTS SUBSEQUENTLY ACHIEVED BY ANY PARTICULAR
TRADING PROGRAM.
ONE OF THE LIMITATIONS OF HYPOTHETICAL PERFORMANCE RESULTS IS THAT THEY ARE
GENERALLY PREPARED WITH THE BENEFIT OF HINDSIGHT. IN ADDITION, HYPOTHETICAL TRADING DOES NOT INVOLVE
FINANCIAL RISK, AND NO HYPOTHETICAL TRADING RECORD CAN COMPLETELY ACCOUNT FOR THE IMPACT OF FINANCIAL
RISK IN ACTUAL TRADING. FOR EXAMPLE, THE ABILITY TO WITHSTAND LOSSES OR TO ADHERE TO A PARTICULAR
TRADING PROGRAM IN SPITE OF TRADING LOSSES ARE MATERIAL POINTS WHICH CAN ALSO ADVERSELY AFFECT ACTUAL
TRADING RESULTS. THERE ARE NUMEROUS OTHER FACTORS RELATED TO THE MARKETS IN GENERAL OR TO THE
IMPLEMENTATION OF ANY SPECIFIC TRADING PROGRAM WHICH CANNOT BE FULLY ACCOUNTED FOR IN THE PREPARATION OF
HYPOTHETICAL PERFORMANCE RESULTS AND ALL OF WHICH CAN ADVERSELY AFFECT ACTUAL TRADING RESULTS.